Subscribe to Marlin magazine and get a year of highly collectible, keepsake editions – plus access to the digital edition and archives. Sign up for the free Marlin email newsletter.
Remember as a kid when you put a mask on and looked under the water for the first time? The difference in what you saw was like night and day once you had a clear view of what was beneath the water’s surface. Similarly, personal bathymetric generators do the same for today’s serious offshore fisherman. The advantage with PBGs is that you are recording the detailed bottom conditions of your specific fishing area into a high-resolution image. You may then utilize your own prerecorded PBGs on your chart plotter.
Swath Mapping Begins
Here in the contiguous US, coastal cartography is available to recreational users, which includes some underwater topography. Swath mapping was developed in the 1970s, but the level of detail was not as high as today’s technology allows. Today, with the increase in data points up to 50 channels per swath or pass over an area, these PBGs are in 3D and are exponentially more detailed than ever before. We have come a long way from the first recorded evidence of water-depth measurements, which were taken in ancient Egypt more than 3,000 years ago.
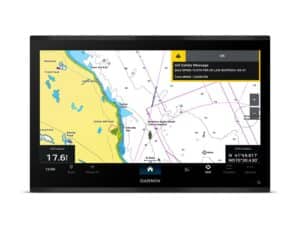
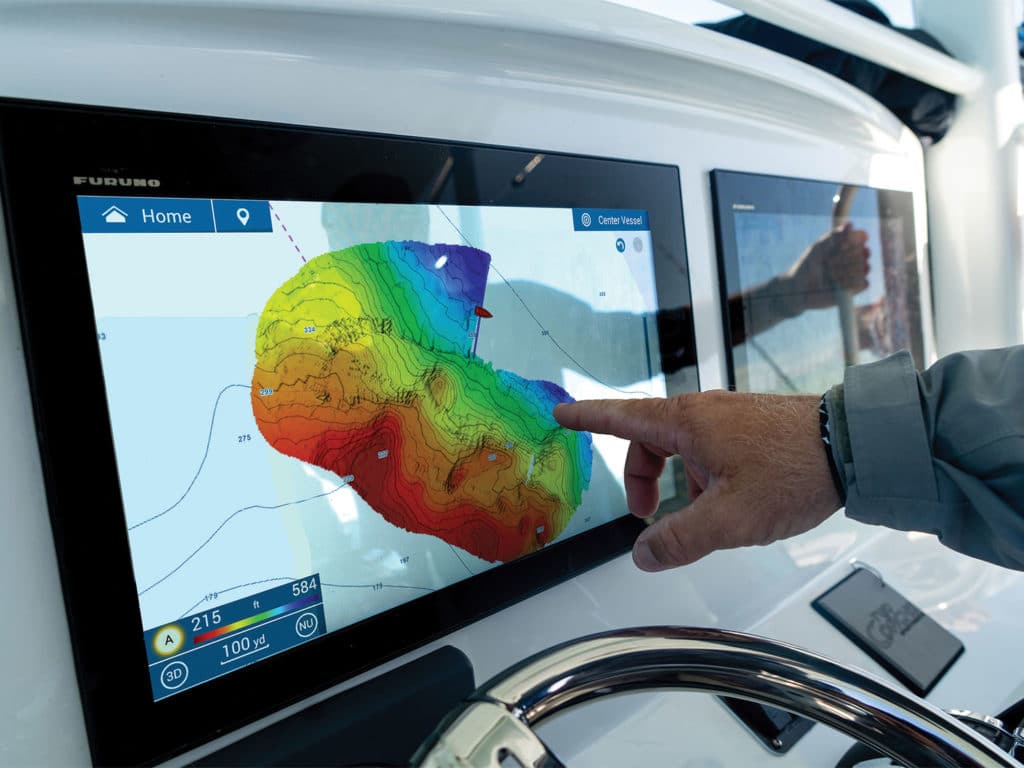
Generating PBGs is an option for a few different manufacturers, but in this example, let’s consider that we are using Furuno’s TZtouch3 and, more specifically, its B165 family of multibeam sonar transducers with the DFF-3D echo sounder. Each time the transducer sends a ping, it records data points in a 120-degree-wide beam. The term multibeam means that with the B165T, each ping records 50 individual data points, using the multiple echo returns to build your own personal bottom maps in extremely high resolution. The quality of detail in these PBG recordings is so high that you will probably find structure not shown on other maps or other forms of cartography, and it’s also right in your own fishing areas.
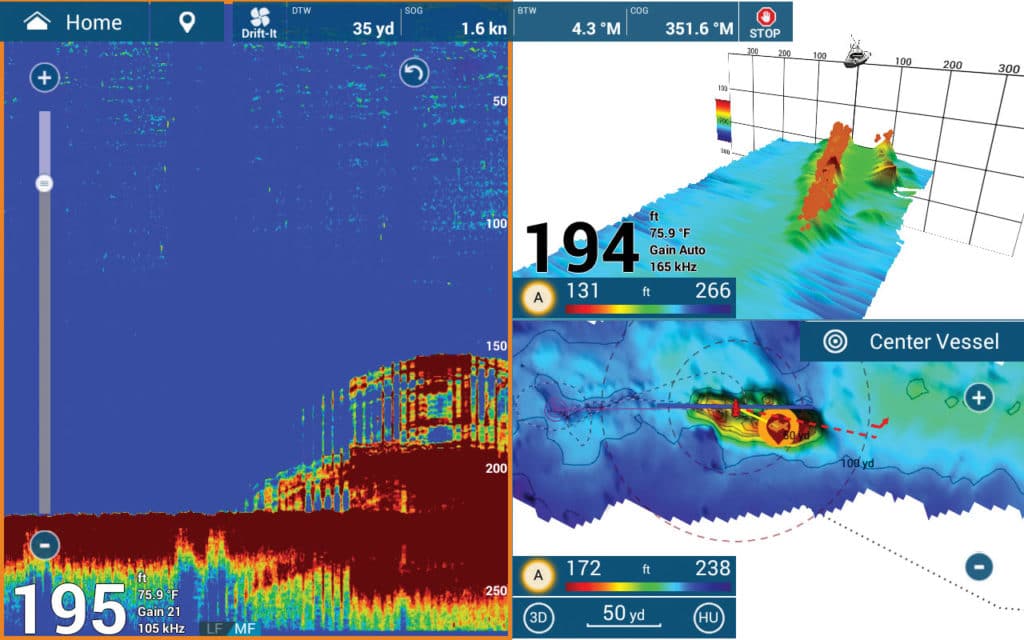
Valuable information, such as depth contours, structure and bottom data, is constantly recorded in survey quality. The recorded data is then displayed in variable colors on custom-shaded relief images in 3D, allowing the user to easily interpret the seabed floor. When gathering or recording your own PBGs to calculate how much area you may record on each pass with your boat, understand that your map will cover twice the area as your depth. So, basically, in 100 feet of water, you will record 200 feet of the bottom in your most frequently fished areas—you can quickly cover a lot of seabed. Note that Furuno recommends for the most precise recording of your PBG data, you’ll need to use a satellite compass with a heave compensation feature while you are actively recording.
High Resolution, Right at Home
User-friendly bottom topography showing canyons, ledges and drop-offs will afford you an advantage not easily matched by others fishing in the same area. For example, I live in Marathon in the Florida Keys, where we have a constantly changing bottom due to the extreme currents at tidal changes, and also due to storms and hurricanes. The water depth here goes from shallow around the nearshore reefs out to several thousand feet deep past the humps at the drop-off.
Local charter skipper Capt. Kavon Mehrani shared with me that the Marathon humps are like a series of miniature underwater mountains that rise up from the bottom. They are the only real structure within many miles, and this makes for some amazing fishing when the conditions are right. He added that having his own detailed bottom topography helps him consistently catch more fish. This detailed bottom imagery really is a game-changer when deep-dropping as well.
Having fished the Marathon humps many times, I was impressed when I recently got to fish there and see the PBGs of the area for the first time. What a difference—the PBGs showed the individual nooks and crannies in the bottom topography that are simply not shown on any other form of imagery. There are pockets and valleys not shown on conventional cartography that we clearly see on our PBGs. It’s a wealth of additional knowledge.
Speaking with a friend and avid fisherman who is now using his own PBGs, he related that even though he had fished one of his favorite wrecks numerous times, when he finally recorded the PBGs himself, he had made a surprising discovery. He had originally thought that the wreck was broken into two pieces; now on his chart plotter, his PBGs show not two but three clearly defined sections of the wreck. Additionally, it shows him a better orientation of the wreck sections, which allows him to approach his favorite fishing spot knowing exactly where the fish are holding.
Read Next: Get a closer look at what’s around the boat using 360-degree sonar.
More than 70 percent of Earth is covered in water, which represents almost two-thirds of the planet. More than 80 percent of our oceans remain unmapped, unobserved and unexplored. It’s safe to say that we understand more about the surface of the moon than we do the depths of our own planet, and much remains to be learned from exploring the mysteries of the deep.
Finding Structure, Maintaining Memory
In 2016, an international group called Nippon Foundation-GEBCO launched efforts on a seabed project. They are working together with global collaborators to map the entire ocean floor by 2030. It’s a huge undertaking because most of the planet is covered by deep oceans, and as of 2019, they had mapped a total of only 19 percent of the world’s seafloor. There are still some areas with absolutely no available bottom cartography, so recording your own PBGs would be a huge resource for fishermen there. Scientists have said that the greatest potential for new discoveries will come from these unmapped regions of deep ocean.
Finding new hidden underwater structure has never been easier. Furuno states that its DFF-3D contains enough memory for recording years of your own PBGs; you could record your own bottom topography daily for up to a decade without the need to add more PBG memory. Sounds like the perfect technology to explore some new fishing grounds and step up your game to new heights.